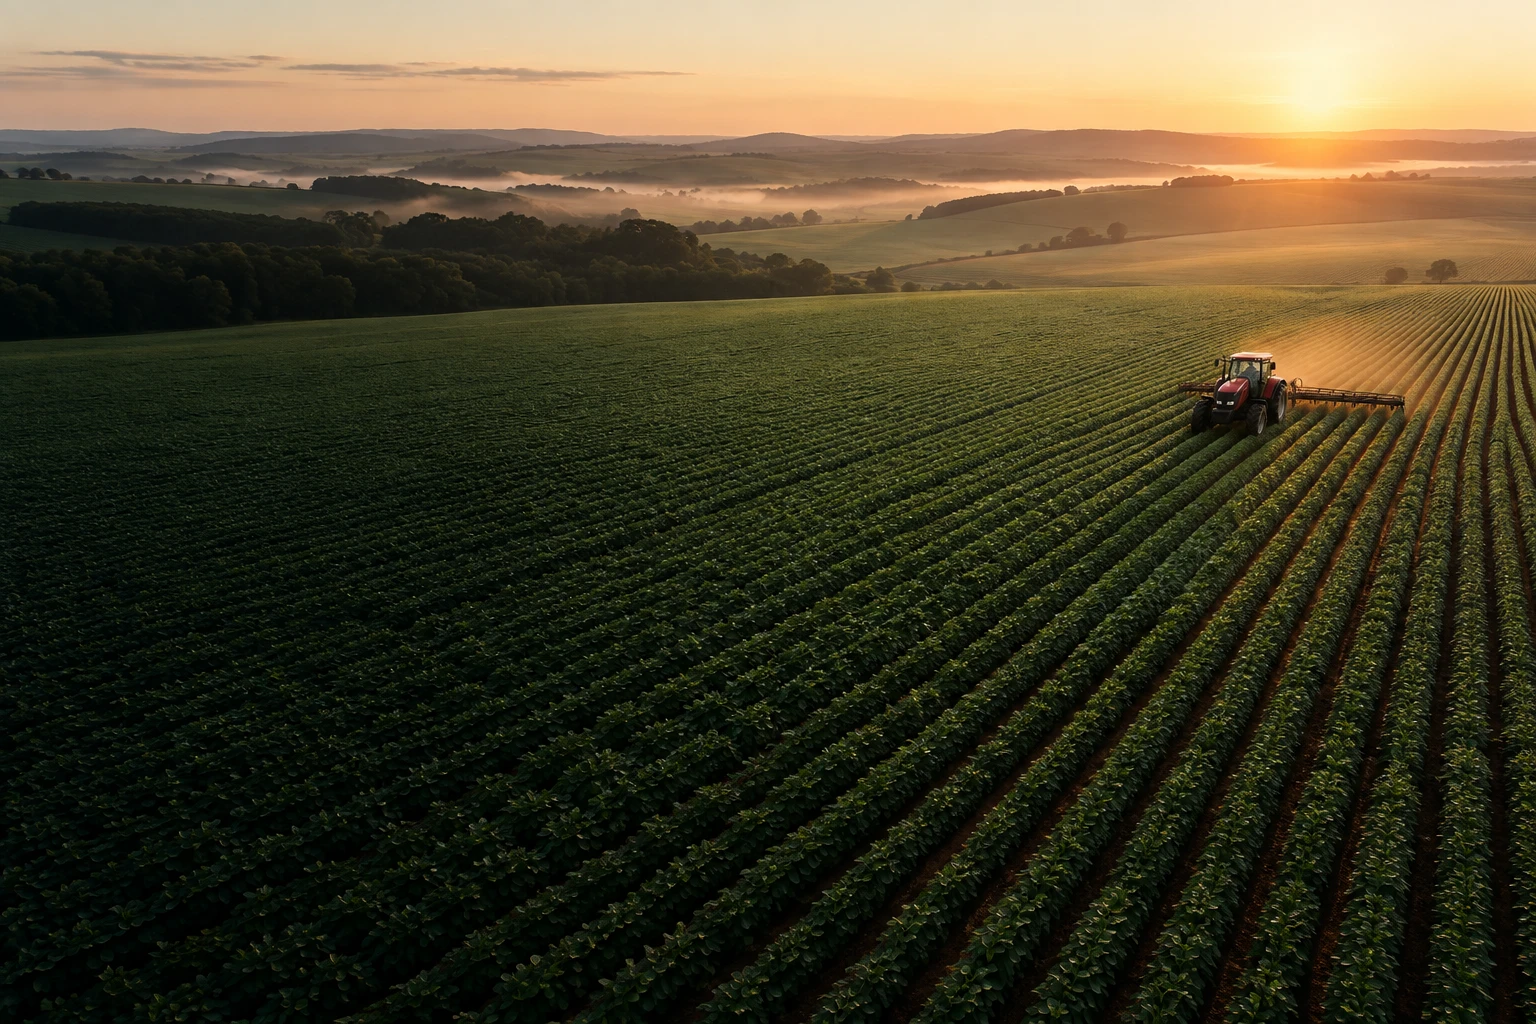
Illustrative aerial view of a Brazilian farm at sunset, with a tractor and crop rows

GEOGRAPHIC INTELLIGENCE. FIELD PRECISION.

Your field has
a lot to say.
Turn it into decisions.

Connect maps, machines and agronomic knowledge. From the first file to a planned operation, discover a new way to understand every hectare.

◎One platform. From insight to delivery.
Potential is in the details.Data connected to field reality
↗
GEOFARM PRO / PRECISION AGRICULTUREDiscover your next step ↓
21connected capabilities
GFFfrom grower to field
GIS + ISO-XMLdata prepared for delivery
PT / ENpresentation in two languages

01 / CONNECTED VIEW

Less scattered data.
More context for decisions.

Variability exists. What changes is your ability to understand it. Bring field information together, find patterns and turn analysis into a project you can review and deliver.

Layer explorationDEMONSTRATION FIELD
LowerHigher
Conceptual visualization · no real customer data

ONE FIELD. DIFFERENT PERSPECTIVES.

↗

Explore the layers and see how each one answers a different management question.

02 / YOUR COMPLETE TOOLKIT

Every field challenge.
A tool to move forward.

Explore what each feature does, why to use it and what it delivers. From collection to the terminal, choose where your work begins.

01 / Planning↗

Guidance lines

Every pass starts with a better plan.

AB, curves and pivotHeading optimization
Explore feature+

Design AB, curved, pivot and multiswath guidance from the field boundary. Adjust heading, working width, headlands and turning geometry to the machine and implement. Review the layout before export.

  • AB, curves and pivot
  • Heading optimization
  • Headlands and turns

Why it matters

Organize passes to help reduce overlaps and unnecessary turns.

What you deliver

Guidance project and report for review and export.
02 / Analysis and insights↗

Variable-rate prescriptions

A rate for every part of the field.

Liming and fertilizationCommercial product conversion
Explore feature+

Turn soil attributes, zones and indices into spatial recommendations. Configure the agronomic method, parameters, commercial product concentration, rate limits, classes and rounding. Review the map before sending it to the terminal.

  • Liming and fertilization
  • Commercial product conversion
  • Rate classes and limits

Why it matters

Target inputs according to variability, with explicit technical criteria.

What you deliver

Zone rate map; recommendations require agronomic validation.

03 / Planning↗

Elevation and cut/fill

Understand the terrain before moving soil.

Contours and terracesLeveling and cut/fill
Explore feature+

Interpolate elevation points to study terrain, contours and terraces. Plan leveling, cut/fill, rice levees and water paths with adjustable project parameters.

  • Contours and terraces
  • Leveling and cut/fill
  • Levees and water flow

Why it matters

Plan interventions and assess earthwork based on survey data.

What you deliver

Terrain surface and design layers; accuracy depends on the input survey.

04 / Analysis and insights↗

Yield maps

See the harvest in detail.

Outlier filteringMoisture correction
Explore feature+

Select yield and moisture attributes, remove outliers and apply moisture correction. Configure interpolation, classes and legends to interpret within-field variability.

  • Outlier filtering
  • Moisture correction
  • Yield zones

Why it matters

Separate sensor noise from yield differences before making decisions.

What you deliver

Processed yield map for analysis and comparison.

05 / Analysis and insights↗

Imagery and remote sensing

See variability beyond the visible.

NDVI · NDRE · SAVI · GNDVIGap and infestation thresholds
Explore feature+

Map spectral bands already available in source attributes and calculate NDVI, NDRE, SAVI and GNDVI. Classify vigor, potential gaps and infestation and compare dates to guide field scouting.

  • NDVI · NDRE · SAVI · GNDVI
  • Gap and infestation thresholds
  • Temporal comparison

Why it matters

Prioritize investigation in areas that need attention.

What you deliver

Index and temporal change maps; indices require the appropriate bands.

06 / Capture and foundation↗

Drone surveys

From flight to a first field assessment.

Flight audit and PPKQuicklook mosaic and RGB vigor
Explore feature+

Import geotagged photos and PPK support files. Inspect flight paths, footprints, GSD, overlap and quality; create a quick mosaic, RGB indices, count estimates, rows and flight plans.

  • Flight audit and PPK
  • Quicklook mosaic and RGB vigor
  • Counts, rows and planning

Why it matters

Validate survey coverage and turn imagery into scouting targets.

What you deliver

Flight layers and exploratory analysis. Quicklook does not replace photogrammetric orthorectification.

07 / Analysis and insights↗

Soil fertility

Give laboratory results a place on the map.

Laboratory importsAttribute maps
Explore feature+

Associate laboratory results with sampling points, select the attribute and tune interpolation. Visualize nutrient distribution and use quick liming and fertilization recommendations as technical support.

  • Laboratory imports
  • Attribute maps
  • Interpolation and recommendations

Why it matters

Connect chemical analysis with spatial field variability.

What you deliver

Fertility maps and prescription inputs, subject to technical review.

08 / Capture and foundation↗

Soil sampling

Better sampling starts with a better plan.

Adjustable grid and densityIdentified points
Explore feature+

Define the boundary, method, density and grid geometry. Generate identified points and export the plan to guide collection and later match laboratory results.

  • Adjustable grid and density
  • Identified points
  • Field collection export

Why it matters

Standardize point distribution and sample traceability.

What you deliver

Georeferenced sampling plan with point identifiers.

09 / Analysis and insights↗

Management zones

Different layers. One management view.

Multi-layer criteriaConfigurable classification
Explore feature+

Combine criteria from different layers, define classification and zone count, and tune interpolation. Use the result to distinguish environments and inform sampling and prescription decisions.

  • Multi-layer criteria
  • Configurable classification
  • Prescription workflow

Why it matters

Group areas with similar behavior to plan interventions.

What you deliver

Management-zone map linked to its field.

10 / Planning↗

Irrigation and drainage

Plan water management around the terrain.

Water zonesDrainage lines
Explore feature+

Use elevation points or water-related attributes to classify excess and deficit zones. Configure flow or distribution lines, interpolation and visualization to study water management.

  • Water zones
  • Drainage lines
  • Distribution and terrain

Why it matters

Locate critical areas and organize drainage or irrigation planning.

What you deliver

Planning maps and lines; these do not represent valve automation.

11 / Planning↗

Traffic and crop damage

Plan planting around wheel tracks.

Sprayer geometryRow shutoff
Explore feature+

Configure sprayer, track width, tires and planter. Simulate wheel tracks and row shutoff to coordinate passes and assess planting against subsequent field traffic.

  • Sprayer geometry
  • Row shutoff
  • Wheel-track analysis

Why it matters

Anticipate conflicts between plant positions and machine traffic.

What you deliver

Traffic and planting plan; outcomes depend on execution and equipment.

12 / Planning↗

Tree and seedling planting

Every plant in its planned position.

Layout and spacingDensity by zone
Explore feature+

Configure layouts, spacing, orientation and variable density by zone. Generate planting points and inter-row guidance; use georeferenced aerial imagery to support recognition of existing rows.

  • Layout and spacing
  • Density by zone
  • Points and inter-row lines

Why it matters

Match planting layout to the field and machine movement.

What you deliver

Exportable planting points and guidance lines.

13 / Capture and foundation↗

Boundaries and fields

The foundation for every project.

Map drawing and editingBoundary import
Explore feature+

Import, draw or reuse boundaries, organize references and save the field limit. Use the same geometry across studios to clip analyses and keep projects consistent.

  • Map drawing and editing
  • Boundary import
  • Reuse across studios

Why it matters

Avoid redefining the area for every analysis and keep a shared reference.

What you deliver

Georeferenced boundary associated with the farm structure.

14 / Management↗

Grower, farm and season

Your data with location and context.

GFF hierarchyDataset associations
Explore feature+

Organize growers, farms, fields and seasons in a farm hierarchy. Link maps and datasets to their corresponding area to retrieve projects and track work history.

  • GFF hierarchy
  • Dataset associations
  • Season organization

Why it matters

Keep context while working across properties and clients.

What you deliver

Organized record of areas, seasons and related maps.

15 / Capture and foundation↗

File imports

Different files. One organized workflow.

Shapefile, GeoJSON and KMLTables and agricultural packages
Explore feature+

Upload geographic data and agricultural packages through the wizard, inspect the recognized structure, preview it and associate it with a field. Manufacturer profiles depend on format and available support.

  • Shapefile, GeoJSON and KML
  • Tables and agricultural packages
  • Preview and GFF association

Why it matters

Reduce manual steps in preparing and organizing incoming data.

What you deliver

Datasets ready for inspection, analysis and conversion according to format.

16 / Management↗

Maps, tables and layers

Maps and numbers tell the same story.

Map and attribute tableLegends and colors
Explore feature+

Explore map layers, inspect tabular attributes and adjust legends and colors. Review metadata, farm associations and compatibility before using a dataset in another studio or exporting it.

  • Map and attribute table
  • Legends and colors
  • Metadata and compatibility

Why it matters

Inspect source information before transforming data.

What you deliver

Reviewed dataset with visual representation and technical context.

17 / Planning↗

Machines and implements

Planning matched to your equipment.

Reusable combinationsDimensions and offsets
Explore feature+

Register machine and implement combinations with working dimensions. Reuse parameters across studios to align width, offsets and turning geometry with planning.

  • Reusable combinations
  • Dimensions and offsets
  • Guidance integration

Why it matters

Avoid repeated setup and assess plans using actual equipment parameters.

What you deliver

Configured equipment combination for field projects.

18 / Delivery↗

Export and conversion

From project to destination format.

GIS and spreadsheetsISO-XML / TASKDATA
Explore feature+

Select dataset, format and destination profile. Review options and validation before downloading GIS files, tables, ISO-XML and available specific packages. Compatibility must be checked by model and content.

  • GIS and spreadsheets
  • ISO-XML / TASKDATA
  • Destination profiles and validation

Why it matters

Prepare deliverables against the technical requirements of the destination.

What you deliver

File validated against its profile; proprietary formats may require an SDK or integration.

19 / Delivery↗

Library and compatibility

Know what the destination requires.

Technical catalogCompatibility matrix
Explore feature+

Consult and organize equipment, format and profile information. Use the compatibility matrix to distinguish available, partial or integration-dependent support and guide delivery.

  • Technical catalog
  • Compatibility matrix
  • Equipment profiles

Why it matters

Identify restrictions before transferring files to a terminal.

What you deliver

Technical reference for format and profile selection.

20 / Management↗

Support and documentation

Knowledge that supports your operation.

Tool-specific manualsTickets and priorities
Explore feature+

Access technical chapters by feature and open tickets with context, priority, files and a problem description. Follow progress and replies to preserve request history.

  • Tool-specific manuals
  • Tickets and priorities
  • Reply tracking

Why it matters

Make issues easier to reproduce and tools easier to use consistently.

What you deliver

Usage documentation and support request history.

21 / Analysis and insights↗

Operation maps

What was done, layer by layer.

Planting and fertilizationSpraying and harvesting
Explore feature+

Inspect planting, fertilization, spraying and harvesting data. Identify attributes and units, review readings and visualize the spatial distribution of machine-recorded measurements.

  • Planting and fertilization
  • Spraying and harvesting
  • Attributes, units and filtering

Why it matters

Review spatial execution and investigate inconsistencies in records.

What you deliver

Operation layers for inspection and analysis; dependent on imported data.

Illustrative schematic maps created to explain the tools. They are not app screenshots or results from a real property.

03 / FROM FILE TO OPERATION

A workflow that follows
your thinking.

Start with the data you already have. Connect tools according to your project needs and keep the field as a shared reference.

01

Collect and organize

Import files, inspect attributes and link them to grower, farm, field and season.

02

Understand variability

Combine soil, imagery, yield and terrain to investigate within-field differences.

03

Plan the intervention

Generate zones, prescriptions, guidance and projects with reviewable technical parameters.

04

Validate and deliver

Select the destination, check compatibility and export your work.

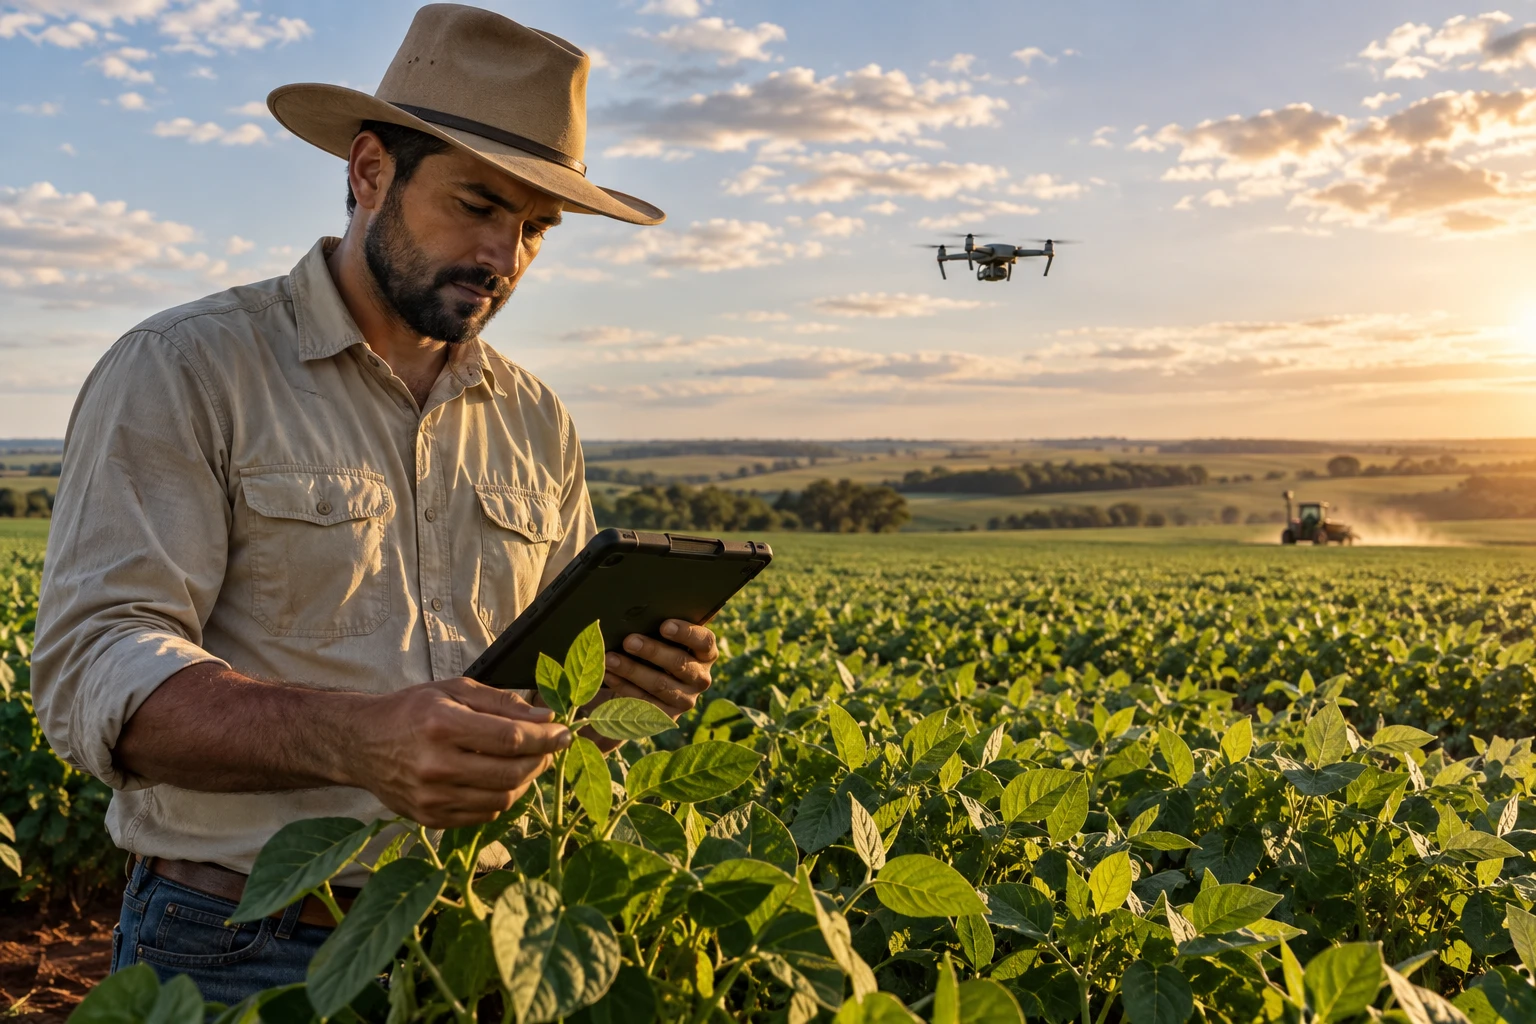
Illustrative image of an agronomist with a tablet inspecting crops, with a drone in the background

04 / TECHNOLOGY WITH PURPOSE

Built for those who
know the field.

Agronomic expertise remains yours. GeoFarm Pro helps organize evidence, visualize possibilities and prepare the next action.

Consultants and technical teams

Structure projects, review parameters and standardize deliverables across clients.

Growers, cooperatives and mills

Connect fields, seasons and operations for an organized view of your farm.

Dealers and service providers

Match projects to equipment and check the requirements of each destination format.

05 / INTEROPERABILITY

Your work needs
to reach its destination.

Open formats for sharing. Specific profiles for preparing operations. Always check the terminal model, version and supported data type.

01 / GIS

Shapefile · GeoJSON
KML/KMZ · GeoPackage

Maps, geometries and attributes for exchange with geographic tools.

02 / DATA

CSV · XLSX
DXF · GML · WKT

Tables and technical formats for analysis and further project work.

03 / FIELD

ISO-XML · AGD · AGS
Trimble · Altimetry JSON

Packages according to available profiles and equipment requirements.

◎

Transparent compatibility: support may be full, partial or depend on integrations, SDKs and credentials. Profile validation guides delivery; it does not imply universal support for every brand and version.

06 / FREQUENTLY ASKED QUESTIONS

Before the
next step.

Do I need to use every tool?+

No. Start with your objective: review a map, plan guidance, analyze soil or prepare an export. Field-organized data can be reused in other studios.

Can I work with files from different machines?+

Yes, according to supported formats and profiles. Check the compatibility matrix for your terminal, version and content. Proprietary formats may require additional resources.

Can an RGB photo produce NDVI?+

No. NDVI requires near infrared (NIR) and red bands. The drone studio also uses RGB indices for exploratory vigor analysis; these are not equivalent to multispectral NDVI.

Does the drone mosaic replace photogrammetry?+

Quicklook supports rapid inspection and assumes conditions such as approximately flat terrain and a nadir camera. Projects requiring orthorectification and survey accuracy need appropriate processing and validation.

Are the maps on this page real results?+

They are demonstration illustrations. Field images were generated with AI. App results depend on input data, settings and technical validation.

How can I explore the solution for my operation?+

Open the app or contact a specialist using the link on this page. Bring information about your crops, file formats, equipment and project goals.

THE NEXT STEP STARTS WITH A BETTER VIEW.

Turn what you know
into a field of possibilities.